Shaarli
Shaarli
Tag cloud
Daily
RSS Feed
Login
Remember me
3345
shaares
339
private links
3345
shaares ·
339
private links
Filters
Links per page
20
50
100
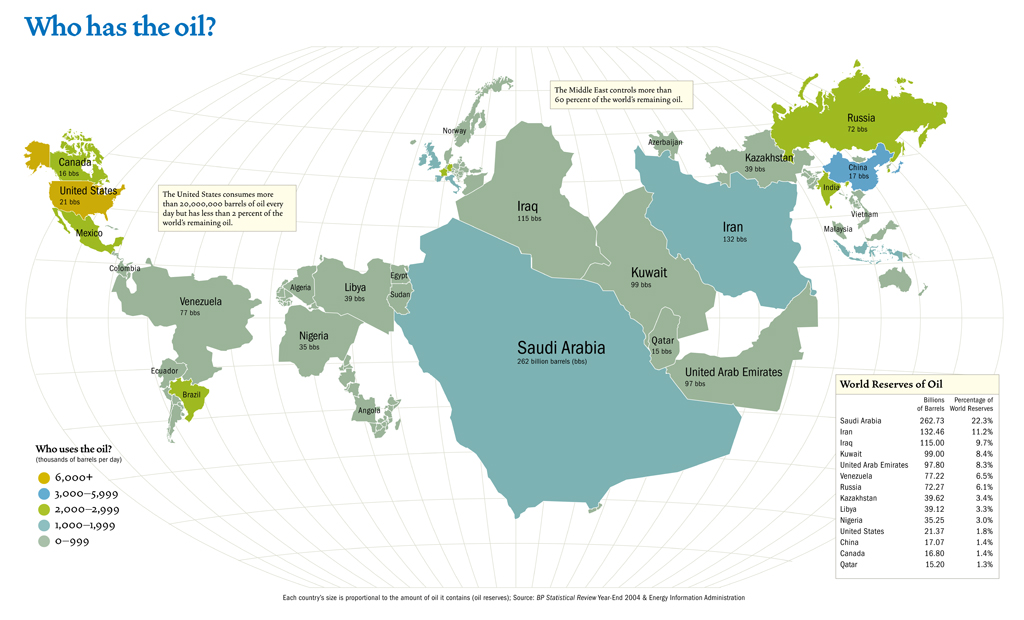
Who has the oil?
A map scaling countries by their oil production and coloring them by their usage.
maps
·
oil
·
politics
·
energy
·
economics
·
image
·
design
·
information
·
visualization
September 14, 2007 at 12:59:24 PM UTC ·
permalink
·
http://www.blog.thesietch.org/wp-content/uploads/2007/09/map01_1024.jpg
Filters
Links per page
20
50
100
Fold
Fold all
Expand
Expand all
Are you sure you want to delete this link?
Are you sure you want to delete this tag?
The personal, minimalist, super fast, database-free, bookmarking service by the Shaarli community
